Home School Researcher Volume 38, No. 1, 2022, p. 1-13

College of Education and Behavioral Sciences
Houston Christian University, Houston, Texas, ltreleaven@hbu.edu
Abstract
Homeschools have grown in prevalence in recent decades in the United States, including an unprecedented increase in homeschooling rates during the COVID-19 pandemic. The present quantitative study sought to add to the growing homeschool research by examining an existing depersonalized data set of test taker demographics and scores on the Classic Learning Test (CLT) from 2016 through March 2021 (n = 12,972). IBM SPSS 27 and 28 were used to assess how the CLT scores of homeschool students compare to the CLT scores of students from other school types. Results showed that on the adjusted total score, homeschool students scored significantly higher than students from all other school types aside from “other” at the p = .05 level, ranging from a 3 to 12.1 point difference. On the adjusted verbal section, homeschool students scored significantly higher than students from all other school type groups aside from “other” at the p = .05 level by 1.296 to 4.454 points. On the adjusted writing section, homeschool students scored significantly higher than students from all other school type groups aside from “other” at the p = .05 level by 1.6 to 5.4 points. On the quantitative section, homeschool students scored significantly higher than only the public school students and “not provided” groups at the p = .05 level by 1.436 to 2.310 points. This is consistent with prior research findings of superior academic performance of homeschool students as compared to other school types.
Keywords: homeschools, homeschooling, academic achievement, Classic Learning Test, assessment, quantitative, achievement testing, aptitude test
Despite their growing prevalence in the United States, comparatively little is known about homeschools in proportion to what is known about other school types, including newer entities such as charter schools (Gaither, 2017; Murphy, 2012). Due to variations in the homeschool documentation required by state, even the size and composition of the homeschool population of the United States is not known (McQuiggan & Megra, 2017). Prior to the COVID-19 pandemic, one often-cited estimate suggested that homeschooled children accounted for between 2.5 and 3.4% of all school-aged children (McQuiggan & Megra, 2017). The COVID-19 pandemic spurred unprecedented homeschooling rates in the United States; the Census Bureau estimates from its Household Pulse survey that the national K-12 homeschooling rate was 11% in 2020-2021 (Eggleston & Fields, 2021).
Contributing to the sense that little is known about homeschools is the fact that several factors make it challenging for researchers to study the homeschool population (Gaither, 2017; Murphy, 2012). The variation in or lack of information about homeschools at the state level makes identifying and contacting homeschools difficult for researchers (Gaither, 2017). When a homeschool is eventually located for research, it represents a small number of students, in contrast to other school types with high concentrations of potential research subjects in one location. Additionally, researchers have noted a higher-than-average resistance to participating in research within the homeschool population, perhaps due to values such as privacy, independence, and a desire for non-traditional lifestyles that motivate some families to pursue homeschooling (Murphy, 2012). Lastly, a theme in recent research is recognizing the heterogeneity present in the homeschool population, making drawing conclusions about the population as a whole challenging (Sikkink & Skiles, 2015).
While literature on homeschools is increasing, common criticisms of this growing body of research include the scarcity of quantitative studies, small sample sizes, and potential researcher bias due to institutional affiliation or compensation (Brewer & Lubienski, 2017; Gaither, 2017; Martin-Chang et al., 2011; Murphy, 2012). Of particular interest is the topic of academic achievement in homeschools, as homeschool supporters and critics alike have an interest in this data as one representation of the outcomes of the practice of homeschooling (Martin-Chang et al., 2011; Murphy, 2012).
Review of Literature
Existing literature on homeschools frequently reports the academic achievement of homeschool students as comparing favorably or exceeding that of traditionally schooled students on various measures of academic performance. Rudner’s (1999) large-scale study examined the performance of 20,760 K-12 homeschool students on the Iowa Tests of Basic Skills or the Tests of Achievement and Proficiency. Rudner (1999) obtained the data from the testing entity, and participants’ parents did not know their students’ scores before participating in the study. Rudner (1999) found that “the achievement test scores of this group of home school students are exceptionally high–the median scores were typically in the 70th to 80th percentile” (p. 1) and that “on average, home school students in grades 1 to 4 perform one grade level above their age-level public/private school peers” (pp. 27-28). Rudner (1999) also found no significant differences in achievement in regard to gender or whether the student’s parent held a teaching certificate (p. 28). However, Rudner (1999) did find significant differences in achievement based on “money spent on education, family income, parent education, and television watching” (p. 28). Limitations of the study include the self-selected nature of the sample, being students whose parents who sought out testing; the fact that in some cases, parents served as proctors for their own children; and the fact that the research was conducted with a grant from HSLDA, a prominent homeschool advocacy organization (Rudner, 1999). In addition, Rudner (1999) emphasized that the methodology of the study cannot establish homeschooling as the cause of the superior academic performance.
A decade later, Ray’s (2010) nationwide study analyzed data on the performance of 11,379 homeschool students on one of several standardized academic achievement tests, including the Iowa Test of Basic Skills and the California Achievement Test. When student test score data were standardized to z-scores to provide an overall picture of homeschool student performance across all of the tests in the sample, results showed that “homeschool student achievement test scores are exceptionally high,” with the mean scores of homeschool students for every subtest examined falling at the 80th percentile or above (p. 43). In order to investigate the possibility of self-selected sample bias on the part of parents, Ray (2010) analyzed the differences between parents who knew the scores of their child before participating in the study versus those who did not, as well as the difference in scores between students whose parents opted to participate in the study and the scores of all of the test takers, including those who did not participate. Ray (2010) found “there are no statistically significant differences in achievement by…whether the parents knew their student’s test score before participating in the study” and “the scores of all students (both participants and non-participants in the study for whom test scores were obtained) were only 2 to 4 percentile points (i.e., 0.10 to 0.16 z-score) lower than the scores of only the homeschool students who participated in the study” (p. 43). As with Rudner’s (1999) study, limitations of Ray’s (2010) study include the self-selected nature of the sample and the fact that parents served as proctors for their own students in some cases. Ray (2010) also acknowledges that the study findings cannot establish homeschooling as the cause for the superior academic performance.
Martin-Chang et al. (2011) aimed to avoid some common methodological shortcomings in their study as they “did not rely on self-reported measures or data gathered by a third party” but instead administered assessments in “controlled conditions by a trained experimenter” (p. 196). They also used “a carefully selected comparison group” rather than focusing exclusively on homeschool students. Martin-Chang et al.’s (2011) administered the Woodcock-Johnson Test of Achievement A Revised to a matched-pair sample of 37 homeschooled and 37 traditionally schooled students. They further divided the homeschool group into ‘structured’ and ‘unstructured’ homeschoolers, with 25 and 12 participants respectively, denoting the degree to which the student’s homeschool educator utilized “organized lesson plans” (Martin-Chang et al., 2011, p. 195). Results of the testing showed that “the children who received structured homeschooling were superior to the children enrolled in public education across all seven subtests” (Martin-Chang et al., 2011, p. 199). Further, “even when the groups were equated on income, the structured homeschooled group had overall superior standardized scores compared with the public school children” (Martin-Chang et al., 2011, p. 199). The small size of the unstructured homeschoolers group limited the ability to make statistical comparisons between unstructured homeschoolers and public school students, but it was noted that “children in the unstructured group had lower scores on all seven academic measures compared with the structured homeschooled group” (Martin-Chang et al., 2011, p. 199). Martin-Change et al. (2011) concluded, “Our results suggest that structured homeschooling may offer opportunities for academic performance beyond those typically experienced in public school” (p. 201). However, the small sample size (n = 74) limited the statistical analyses available and the generalizability of the study.
Other studies of academic achievement have focused on various college entrance exams. Clemente (2006) compared the SAT scores of homeschool students with those of public and private school students. Clemente (2006) collected SAT score data on freshmen entering several Christian colleges and universities in 2005 directly from the higher education institutions, resulting in a sample of n = 2,959 students total, with 222 coming from homeschools. Results showed “in both tests, it was determined that homeschooled students outscored their conventionally schooled counterparts on the Scholastic Aptitude Test. Private-schooled students’ scores were higher than those of the public-schooled students, but the difference was not statistically significant” (p. 44).
Finally, Qaqish’s (2007) study is a counter-example to the findings discussed thus far in that non-homeschoolers showed better academic performance than homeschoolers. Qaqish (2007) investigated the performance of homeschooled and non-homeschooled students on an ACT mathematics achievement test. Qaqish (2007) composed groups of homeschooled and non-homeschooled students using match-paired sampling on the basis of four demographic statistics (n = 1,477). Results showed that “On average, non-homeschoolers performed better than homeschoolers, by about two items, out of sixty items, on the ACT mathematics test that was analyzed” (p. 11).
Objective
The current study endeavored to add to the existing literature on homeschools by drawing quantitative insights about the homeschool population from the Classic Learning Test (CLT) data. The Classic Learning Test assessments are often used by non-public education entities, including charter schools, private schools, and homeschools (Classic Learning Initiatives, 2018). Researchers of existing studies on homeschools have noted a need for quantitative studies as well as studies with substantial sample sizes. The current study aims to address those two needs by seeking quantitative insights from a sizeable sample of existing data.
Hypothesis
The data from the Classic Learning Test was analyzed to answer the following research questions about the use of achievement tests and the academic outcomes in homeschools: How do the scores of homeschool students on the Classic Learning Test compare to the scores of students from other school types?
H0: The scores of homeschool students on each CLT test administration are not significantly different from the scores of students from other school types on the same test administration for CLT tests conducted in the 2016-17, 2017-18, 2018-19, 2019-20 and 2020-21 academic years.
H1: The CLT scores of homeschool students on each test administration differ significantly from the scores of students from other school types on the same test administration for CLT tests conducted in the 2016-17, 2017-18, 2018-19, 2019-20 and 2020-21 academic years (p = .05).
Method
Data Set
The study utilized an existing data set of all student scores on the Classic Learning Test (CLT), CLT10 and CLT8 from the 2016-17, 2017-18, 2018-19, and 2019-20 full academic years as well as July 2020 through March 11, 2021 of the 2020-2021 academic year (n = 29,403). The data set was depersonalized by the Classic Learning Test before transmission to the researcher. Test taker identity is not uniquely identified within the depersonalized data set, so it is possible that one test taker may have contributed multiple cases to the data set through taking multiple tests within the CLT suite or taking the same test type on multiple test dates. Data screening and sample selection procedures described below resulted n = 12,972 records used in the current study.
Data Screening Process
The researcher undertook data screening processes to ensure the integrity of the data throughout the analysis process. The depersonalized data set was imported from spreadsheet format into SPSS 27. The researcher checked the accuracy of the import by comparing frequency tables between the two sources. The data for variables of interest were preserved intact. The researcher verified that the variable type settings chosen by SPSS upon import were appropriate for each variable and the tests to be conducted.
The data screening process also included value cleaning in which the researcher verified, “to the extent that it is possible and within the bounds of feasibility, that the values are within the limits of reasonable expectation” (Meyers et al., 2017, p. 32). First, the expected range or bounded set of responses for each variable was determined. Second, the researcher verified that no variables utilized multiple response coding. Third, frequency tables for each variable were generated in order to identify possible errant or out-of-range values. Fourth, a missing values analysis was performed to assess for non-random patterns of missing values within variables of interest. Fifth, histograms and descriptive statistics were used to determine normality of quantitative data, assess outliers, and identify implausible, possibly errant, values.
The data screening process resulted in two records being excluded from the set due to having adjusted writing scores outside of the score range. All other data on variables of interest were deemed plausible and appropriate.
Sample Selection Process
Only the scores from the Classic Learning Test were utilized for the current study, as the CLT is administered under standardized conditions by proctors who are not related to the examinees, whereas the CLT10 and CLT8 may be administered at home by examinee’s parents. For this reason, the CLT10 and CLT8 data were excluded yielding a sample size of n = 12,972 CLT test records.
Data Preparation
After data screening, the researcher undertook data preparation processes as needed to perform the statistical analyses related to the research questions. These included combining analogous variable values, creating a binned variable, and converting string variables to numerical nominal variables for use in ANOVA calculations in SPSS 27. Combining analogous variable values included recoding variable values such as “NULL,” “blank,” and “Not provided,” into one category: “not provided,” and converting two low frequency variable values in the school type—1 record containing “???” and 39 containing “magnet”—into an existing “other” value. The test date variable was binned into academic years. The researcher chose to include the summer in the preceding academic year due to the use of the CLT as a college entrance exam, making the summer test data representative of the test taker’s previous year of school rather than indicative of the upcoming academic year. Therefore, the binned variable was defined as August 1 to July 31 for each academic year. The transform function in SPSS was used to change several string variables—including test type, school type, gender, ethnicity, and income—into numerical nominal variables for use in ANOVA. After binning and transforming variables, the researcher checked for accuracy of the operation using frequency tables to compare the original and created variable data.
Data preparation also included understanding the score variables in the data set. It should be noted that the test scores in the data set adjusted scores rather than raw scores. As the Classic Learning Test Technical Report explains, “Adjusted score takes item/test difficulty into account for adjustment across test forms” (Classic Learning Initiatives, 2018, p. 45).
Participant characteristics
Descriptive Statistics of Screened Data Set
Demographic data for the screened data set of n = 12,972 scores on the CLT from June 2016 to March 2021 are as follows. Table 1 shows the distribution of the sample among the six school type variable values: homeschool, private, charter, public, other, and not provided.
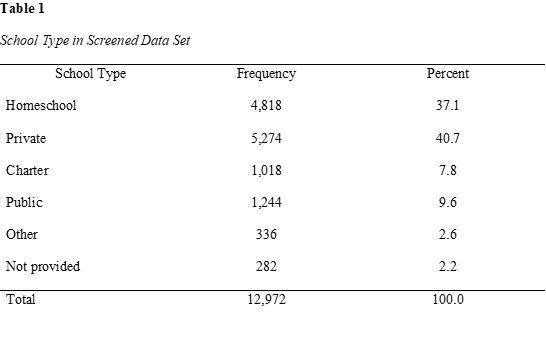
Table 2 shows the distribution of the sample among the six academic year variable values from the 2015-2016 school year through the partial data for the 2020-2021 academic year which was available at the time of the data set acquisition.
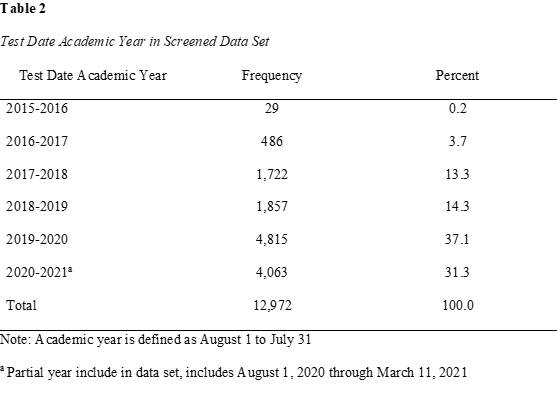
Table 3 shows the distribution of the sample among gender variable values including female, male, and not provided.
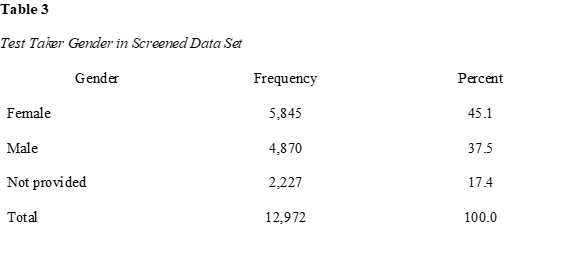
Table 4 shows the distribution of the sample among the eight ethnicity variable values.
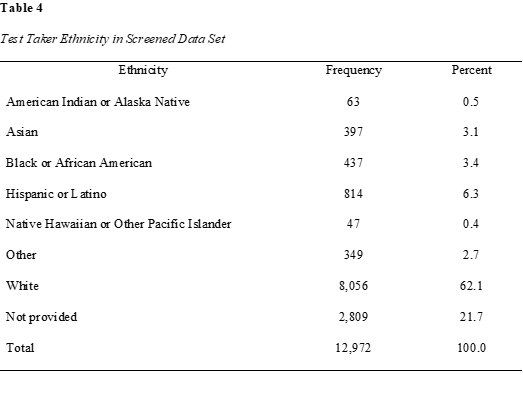
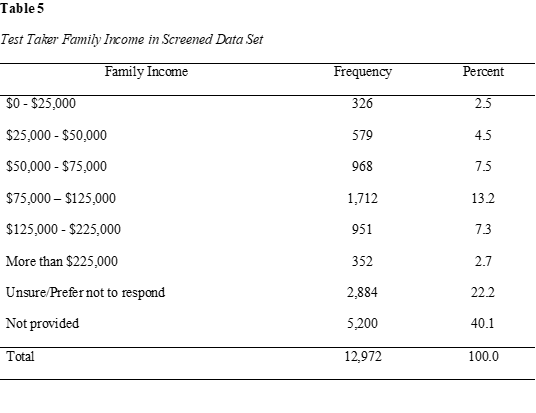
Table 5 shows the distribution of the sample among the eight family income variable values.
Instrumentation
The technical report describes the Classic Learning Test as both an aptitude and achievement test, similar to SAT and ACT. Based on score comparison with SAT and ACT, the technical report states that the CLT is considered “more rigorous” than existing college entrance exams and better able to “differentiate students at the upper tail of the distribution” (Classic Learning Initiatives, 2018, p. 3). The CLT utilizes reading passages from “classic texts” written by authors “whose writings have had a lasting influence on culture and society” as opposed to the informational texts and modern writings commonly used in the SAT and ACT (Classic Learning Initiatives, 2018, p. 3). The target population for the CLT suite of assessments includes students in school settings other than traditional public schools, including private, charter, and homeschool students (Classic Learning Initiatives, 2018, p. 32). It is administered in both online and paper formats in a standardized, proctored testing environment. Proctors are not permitted to oversee the exams of students to whom they are related or to whom they are, or have, served as an athletic coach (Classic Learning Initiatives, 2018, p. 18).
The assessment consists of 120 questions worth 1 point each, with 120 total points possible, distributed equally across Verbal Reasoning, Grammar/Writing, and Quantitative Reasoning sections. There is no penalty for wrong answers. Students have two hours to complete the Verbal Reasoning, Grammar/Writing and Quantitative Reasoning sections. An additional 30-minute optional essay portion is available as well.
The Classic Learning Test commissioned a 2018 concordance study undertaken by two psychometricians who analyzed the data independently first and then compared results as part of the quality control procedures (Classic Learning Initiatives, 2018). The results of the study are summarized in the Classic Learning Test 2018 Technical Report including a concordance table for CLT total scores, ACT composite scores, and SAT total scores and comparable sections between the three assessments (Classic Learning Initiatives, 2018). The reliability of two test versions of the Classic Learning Test was assessed using Cronbach’s Alpha to calculate the reliability coefficient and the standard error of measurement to assess consistency of scores (Classic Learning Initiatives, 2018, p. 56). Analysis of the two test forms yielded a CLT total test score reliability coefficient of .92 with standard error of measurement 4.76 and .95 with standard error of measurement 4.67 respectively. Reliability of the three subtests ranged from .80 to .89 across the two test forms (Classic Learning Initiatives, 2018, p. 56).
Reliability was also assessed for test taker sub-groups including gender, ethnicity, school type, and family income. Overall, reliability testing yielded “highly reliable CLT scores and moderately highly reliable subtest scores” across groups (Classic Learning Initiatives, 2018, p. 58-59). Validity of the Classic Learning Test was established using exploratory factor analysis (EFA) and confirmatory factor analysis (CFA) with results as follows:
EFA supported different numbers of components to be extracted. CFA empirically identified the best fitting model, the three-factor model. This is consistent with the theoretical framework and the theoretical content model in the CLT design and development (Classic Learning Initiatives, 2018, p. 74).
Content analysis also supported the validity of the Classic Learning Test (Classic Learning Initiatives, 2018, p. 75).
Analytic strategy
Variance within the homeschool students’ scores for each year was assessed for equivalence using Levene’s test in order to determine the suitability of using an ANOVA. If the necessary mathematical conditions were met, ANOVA was utilized to compare the mean test scores of test takers from each school type on each test administration. Additionally, demographic variables such as gender, ethnicity, or family income were investigated as a second independent variable in two-way ANOVA such that if the mathematical conditions are met, differences in the performance of these subgroups within each school type can be assessed.
Results
A one-way ANOVA was used to determine if CLT scores varied significantly by student school type. Levene’s test of homogeneity of variance was significant for all score variables, so the Welch test was used as a robust test of equality of means. The sample size, mean, standard deviation and standard error for CLT score variables by school type are shown in Table 6. The results showed that all four scores—the adjusted total score, and the adjusted verbal, writing, and quantitative section scores—did vary significantly by student school type, as shown in Table 7. The null hypothesis was not accepted. A Games-Howell post-hoc test was selected and showed significant values distributed throughout the school type by school type cross-tabulations grouped into partial tables by score variable, as shown in the Table 8.
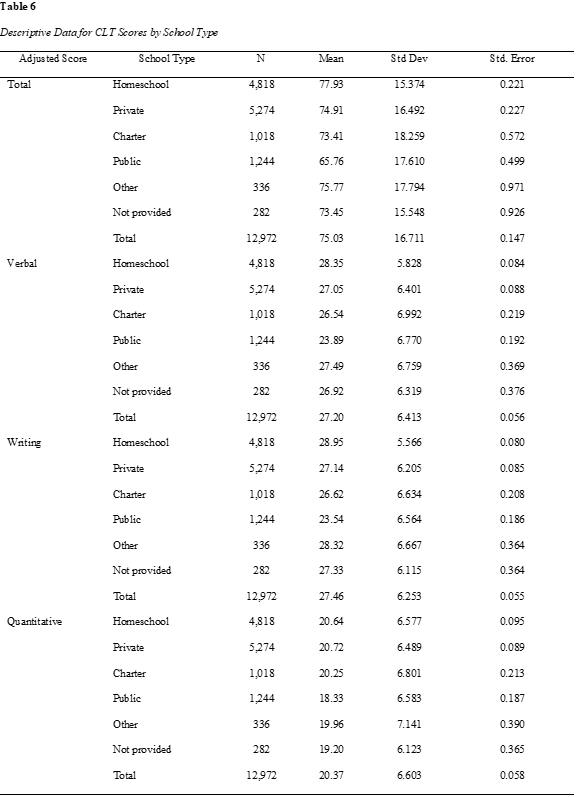
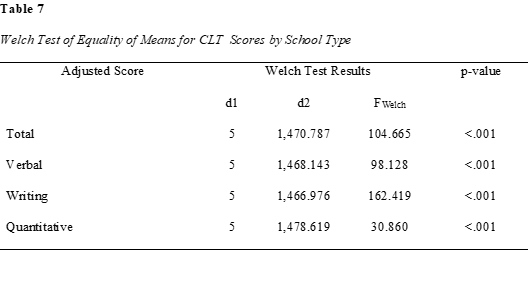
Table 8
Games-Howell post-hoc test for Welch Test of Equality of Means for CLT Scores by School Type
| Adjusted score | Mean Difference (I-J) | Std. Error | Sig. | 95% Confidence Interval | |||||||||
| Lower Bound | Upper Bound | ||||||||||||
| Total | Homeschool | Private | 3.023* | 0.317 | 0.000 | 2.12 | 3.93 | ||||||
| Charter | 4.521* | 0.614 | 0.000 | 2.77 | 6.27 | ||||||||
| Public | 12.170* | 0.546 | 0.000 | 10.61 | 13.73 | ||||||||
| Other | 2.165 | 0.996 | 0.252 | -0.69 | 5.02 | ||||||||
| Not provided | 4.486* | 0.952 | 0.000 | 1.76 | 7.22 | ||||||||
| Private | Homeschool | -3.023* | 0.317 | 0.000 | -3.93 | -2.12 | |||||||
| Charter | 1.499 | 0.616 | 0.145 | -0.26 | 3.26 | ||||||||
| Public | 9.147* | 0.548 | 0.000 | 7.58 | 10.71 | ||||||||
| Other | -0.858 | 0.997 | 0.956 | -3.71 | 2.00 | ||||||||
| Not provided | 1.464 | 0.953 | 0.642 | -1.27 | 4.20 | ||||||||
| Charter | Homeschool | -4.521* | 0.614 | 0.000 | -6.27 | -2.77 | |||||||
| Private | -1.499 | 0.616 | 0.145 | -3.26 | 0.26 | ||||||||
| Public | 7.649* | 0.759 | 0.000 | 5.48 | 9.81 | ||||||||
| Other | -2.356 | 1.127 | 0.293 | -5.58 | 0.87 | ||||||||
| Not provided | -0.035 | 1.088 | 1.000 | -3.15 | 3.08 | ||||||||
| Public | Homeschool | -12.170* | 0.546 | 0.000 | -13.73 | -10.61 | |||||||
| Private | -9.147* | 0.548 | 0.000 | -10.71 | -7.58 | ||||||||
| Charter | -7.649* | 0.759 | 0.000 | -9.81 | -5.48 | ||||||||
| Other | -10.005* | 1.092 | 0.000 | -13.13 | -6.88 | ||||||||
| Not provided | -7.684* | 1.052 | 0.000 | -10.69 | -4.67 | ||||||||
| Other | Homeschool | -2.165 | 0.996 | 0.252 | -5.02 | 0.69 | |||||||
| Private | 0.858 | 0.997 | 0.956 | -2.00 | 3.71 | ||||||||
| Charter | 2.356 | 1.127 | 0.293 | -0.87 | 5.58 | ||||||||
| Public | 10.005* | 1.092 | 0.000 | 6.88 | 13.13 | ||||||||
| Not provided | 2.321 | 1.341 | 0.512 | -1.51 | 6.16 | ||||||||
| Not provided | Homeschool | -4.486* | 0.952 | 0.000 | -7.22 | -1.76 | |||||||
| Private | -1.464 | 0.953 | 0.642 | -4.20 | 1.27 | ||||||||
| Charter | 0.035 | 1.088 | 1.000 | -3.08 | 3.15 | ||||||||
| Public | 7.684* | 1.052 | 0.000 | 4.67 | 10.69 | ||||||||
| Other | -2.321 | 1.341 | 0.512 | -6.16 | 1.51 | ||||||||
| Verbal | Homeschool | Private | 1.296* | 0.122 | 0.000 | 0.95 | 1.64 |
| Charter | 1.805* | 0.235 | 0.000 | 1.14 | 2.48 | ||
| Public | 4.454* | 0.210 | 0.000 | 3.86 | 5.05 | ||
| Other | 0.860 | 0.378 | 0.208 | -0.22 | 1.94 | ||
| Not provided | 1.429* | 0.386 | 0.003 | 0.32 | 2.53 | ||
| Private | Homeschool | -1.296* | 0.122 | 0.000 | -1.64 | -0.95 | |
| Charter | 0.510 | 0.236 | 0.258 | -0.16 | 1.18 | ||
| Public | 3.158* | 0.211 | 0.000 | 2.56 | 3.76 | ||
| Other | -0.436 | 0.379 | 0.860 | -1.52 | 0.65 | ||
| Not provided | 0.134 | 0.386 | 0.999 | -0.97 | 1.24 | ||
| Charter | Homeschool | -1.805* | 0.235 | 0.000 | -2.48 | -1.14 | |
| Private | -0.510 | 0.236 | 0.258 | -1.18 | 0.16 | ||
| Public | 2.648* | 0.291 | 0.000 | 1.82 | 3.48 | ||
| Other | -0.946 | 0.429 | 0.237 | -2.17 | 0.28 | ||
| Not provided | -0.376 | 0.435 | 0.955 | -1.62 | 0.87 | ||
| Public | Homeschool | -4.454* | 0.210 | 0.000 | -5.05 | -3.86 | |
| Private | -3.158* | 0.211 | 0.000 | -3.76 | -2.56 | ||
| Charter | -2.648* | 0.291 | 0.000 | -3.48 | -1.82 | ||
| Other | -3.594* | 0.416 | 0.000 | -4.78 | -2.41 | ||
| Not provided | -3.025* | 0.422 | 0.000 | -4.23 | -1.82 | ||
| Other | Homeschool | -0.860 | 0.378 | 0.208 | -1.94 | 0.22 | |
| Private | 0.436 | 0.379 | 0.860 | -0.65 | 1.52 | ||
| Charter | 0.946 | 0.429 | 0.237 | -0.28 | 2.17 | ||
| Public | 3.594* | 0.416 | 0.000 | 2.41 | 4.78 | ||
| Not provided | 0.570 | 0.527 | 0.889 | -0.94 | 2.08 | ||
| Not provided | Homeschool | -1.429* | 0.386 | 0.003 | -2.53 | -0.32 | |
| Private | -0.134 | 0.386 | 0.999 | -1.24 | 0.97 | ||
| Charter | 0.376 | 0.435 | 0.955 | -0.87 | 1.62 | ||
| Public | 3.025* | 0.422 | 0.000 | 1.82 | 4.23 | ||
| Other | -0.570 | 0.527 | 0.889 | -2.08 | 0.94 |
Table 8 (Continued)
| Adjusted score | Mean Difference (I-J) | Std. Error | Sig. | 95% Confidence Interval |
| Lower Bound | Upper Bound |
Table 8 (Continued)
| Adjusted score | Mean Difference (I-J) | Std. Error | Sig. | 95% Confidence Interval |
| Lower Bound | Upper Bound |
| Writing | Homeschool | Private | 1.806* | 0.117 | 0.000 | 1.47 | 2.14 |
| Charter | 2.325* | 0.223 | 0.000 | 1.69 | 2.96 | ||
| Public | 5.408* | 0.203 | 0.000 | 4.83 | 5.99 | ||
| Other | 0.624 | 0.372 | 0.549 | -0.44 | 1.69 | ||
| Not provided | 1.622* | 0.373 | 0.000 | 0.55 | 2.69 | ||
| Private | Homeschool | -1.806* | 0.117 | 0.000 | -2.14 | -1.47 | |
| Charter | 0.518 | 0.225 | 0.193 | -0.12 | 1.16 | ||
| Public | 3.602* | 0.205 | 0.000 | 3.02 | 4.19 | ||
| Other | -1.183* | 0.374 | 0.021 | -2.25 | -0.11 | ||
| Not provided | -0.184 | 0.374 | 0.996 | -1.26 | 0.89 | ||
| Charter | Homeschool | -2.325* | 0.223 | 0.000 | -2.96 | -1.69 | |
| Private | -0.518 | 0.225 | 0.193 | -1.16 | 0.12 | ||
| Public | 3.084* | 0.279 | 0.000 | 2.29 | 3.88 | ||
| Other | -1.701* | 0.419 | 0.001 | -2.90 | -0.50 | ||
| Not provided | -0.702 | 0.419 | 0.549 | -1.90 | 0.50 | ||
| Public | Homeschool | -5.408* | 0.203 | 0.000 | -5.99 | -4.83 | |
| Private | -3.602* | 0.205 | 0.000 | -4.19 | -3.02 | ||
| Charter | -3.084* | 0.279 | 0.000 | -3.88 | -2.29 | ||
| Other | -4.784* | 0.409 | 0.000 | -5.95 | -3.62 | ||
| Not provided | -3.786* | 0.409 | 0.000 | -4.96 | -2.62 | ||
| Other | Homeschool | -0.624 | 0.372 | 0.549 | -1.69 | 0.44 | |
| Private | 1.183* | 0.374 | 0.021 | 0.11 | 2.25 | ||
| Charter | 1.701* | 0.419 | 0.001 | 0.50 | 2.90 | ||
| Public | 4.784* | 0.409 | 0.000 | 3.62 | 5.95 | ||
| Not provided | 0.998 | 0.515 | 0.379 | -0.47 | 2.47 | ||
| Not provided | Homeschool | -1.622* | 0.373 | 0.000 | -2.69 | -0.55 | |
| Private | 0.184 | 0.374 | 0.996 | -0.89 | 1.26 | ||
| Charter | 0.702 | 0.419 | 0.549 | -0.50 | 1.90 | ||
| Public | 3.786* | 0.409 | 0.000 | 2.62 | 4.96 | ||
| Other | -0.998 | 0.515 | 0.379 | -2.47 | 0.47 |
| Quantitative | Homeschool | Private | -0.080 | 0.130 | 0.990 | -0.45 | 0.29 | |
| Charter | 0.393 | 0.233 | 0.543 | -0.27 | 1.06 | |||
| Public | 2.310* | 0.209 | 0.000 | 1.71 | 2.91 | |||
| Other | 0.683 | 0.401 | 0.530 | -0.47 | 1.83 | |||
| Not provided | 1.436* | 0.377 | 0.002 | 0.36 | 2.52 | |||
| Private | Homeschool | 0.080 | 0.130 | 0.990 | -0.29 | 0.45 | ||
| Charter | 0.473 | 0.231 | 0.316 | -0.19 | 1.13 | |||
| Public | 2.390* | 0.207 | 0.000 | 1.80 | 2.98 | |||
| Other | 0.763 | 0.400 | 0.398 | -0.38 | 1.91 | |||
| Not provided | 1.516* | 0.375 | 0.001 | 0.44 | 2.59 | |||
| Charter | Homeschool | -0.393 | 0.233 | 0.543 | -1.06 | 0.27 | ||
| Private | -0.473 | 0.231 | 0.316 | -1.13 | 0.19 | |||
| Public | 1.917* | 0.283 | 0.000 | 1.11 | 2.72 | |||
| Other | 0.290 | 0.444 | 0.987 | -0.98 | 1.56 | |||
| Not provided | 1.043 | 0.422 | 0.135 | -0.16 | 2.25 | |||
| Public | Homeschool | -2.310* | 0.209 | 0.000 | -2.91 | -1.71 | ||
| Private | -2.390* | 0.207 | 0.000 | -2.98 | -1.80 | |||
| Charter | -1.917* | 0.283 | 0.000 | -2.72 | -1.11 | |||
| Other | -1.627* | 0.432 | 0.003 | -2.86 | -0.39 | |||
| Not provided | -0.873 | 0.410 | 0.273 | -2.05 | 0.30 | |||
| Other | Homeschool | -0.683 | 0.401 | 0.530 | -1.83 | 0.47 | ||
| Private | -0.763 | 0.400 | 0.398 | -1.91 | 0.38 | |||
| Charter | -0.290 | 0.444 | 0.987 | -1.56 | 0.98 | |||
| Public | 1.627* | 0.432 | 0.003 | 0.39 | 2.86 | |||
| Not provided | 0.753 | 0.534 | 0.720 | -0.77 | 2.28 | |||
| Not provided | Homeschool | -1.436* | 0.377 | 0.002 | -2.52 | -0.36 | ||
| Private | -1.516* | 0.375 | 0.001 | -2.59 | -0.44 | |||
| Charter | -1.043 | 0.422 | 0.135 | -2.25 | 0.16 | |||
| Public | 0.873 | 0.410 | 0.273 | -0.30 | 2.05 | |||
| Other | -0.753 | 0.534 | 0.720 | -2.28 | 0.77 | |||
| *. The mean difference is significant at the 0.05 level. |
Table 8 (Continued)
Games-Howell post-hoc test for Welch Test of Equality of Means for CLT Scores by School Type
| Adjusted score | Mean Difference (I-J) | Std. Error | Sig. | 95% Confidence Interval |
| Lower Bound | Upper Bound |
Additional analyses were undertaken to investigate whether scores within school type groups varied by a second independent variable including gender, ethnicity, or family income. To investigate this, two-way MANOVA analyses were conducted with school type and the secondary independent variable [gender, ethnicity, or family income] as fixed factors and the four score variables as dependent variables. However, all three two-way MANOVA tests yielded significant scores on both Box’s Test of Equality of Covariance Matrices and Levene’s Test of Equality of Error Variances. In addition, in each of the two-way MANOVA tests, the group size varied widely with multiple groups having fewer than 4 cases. As such, the two-way MANOVA analyses were not utilized as the interpretation of the results would be limited due to the frequency of small group sizes and the violation of the assumption of homoscedasticity in regard to covariance and between group variance.
Discussion
A one-way ANOVA showed significant variation in CLT test scores by school type. For this test, a robust test of equality of means was used due to a lack of homogeneity of variance. The unequal distribution of the sample among school types, ranging from n = 282 to n = 5274, makes the finding of unequal variance more likely mathematically. A Games-Howell post-hoc test, found in the Table 8 indicated that for the adjusted total score, homeschool students scored significantly higher than students from all other school type groups aside from “other” at the p = .05 level. Homeschool students outscored students from other school types by between 3 and 12.1 points. On the adjusted verbal subtest, homeschool students scored significantly higher than students from all other school type groups aside from “other” at the p = .05 level by 1.296 to 4.454 points. On the adjusted writing section, homeschool students scored significantly higher than students from all other school type groups aside from “other” at the p = .05 level by 1.622 to 5.408 points. On the quantitative section, homeschool students scored significantly higher than only the public school students and “not provided” groups at the p = .05 level by 1.436 to 2.310 points.
Similarity of results
These findings are consistent with other studies in the existing literature which find that homeschool students tend to score higher than students from other school types on standardized tests and other measures of academic achievement (Clemente, 2006; Martin-Chang et al., 2011; Ray, 2010; Rudner, 1999). It is interesting to note that the significant findings were consistent across score variables, with homeschool students outperforming all other school types except “other,” except on the quantitative subtest. The “other” category was pre-existing in the larger CLT data set, but the author also added 40 records from two low-frequency categories into “other” including “?” (1 record) and “Magnet” (39 records) for a total of 583 records citing “other” as school type in the data set. Of these 583 records, 336 were for the CLT test and thus were included in current study sample. These findings provide several possible routes for further research which will be discussed in more detail to follow.
Possible Explanations and Limitations for Homeschool Academic Outcomes Research
As discussed, much of the existing research on academic outcomes in homeschools is favorable, with results suggesting that homeschooled students are performing as well as or better than traditionally schooled students. However, several previously mentioned researchers acknowledge that these findings cannot establish homeschooling as the cause of the superior academic performance (Clemente, 2006; Ray, 2010; Rudner, 1999). Even some critics of the homeschooling movement acknowledge this trend of superior academic achievement with the caveat regarding causation, such as Brewer and Lubienski’s (2017) statement, “While the differences in outcomes between homeschooled students and their public school peers are clear, what is not clear are arguments that there is a causal link between the practice of homeschooling and the higher academic outcomes” (p. 3).
This inability to establish causality applies to the current study as well. It has been suggested that factors other than homeschooling may account for these differences in academic performance between homeschool students and traditionally schooled students. For example, Brewer and Lubienski (2017) suggest that a higher “amount of parent involvement” or “higher level of socioeconomic status” among homeschoolers may lead to higher academic achievement (Brewer & Lubienski, 2017, p. 3).
Some of the studies mentioned previously attempted to analyze the effects of these confounding variables. For example, Rudner (1999) analyzed the effects of several confounding variables affecting academic achievement and found “no meaningful differences in achievement by gender, whether the student is enrolled in a full-service curriculum, or whether a parent holds a state issued teaching certificate.” However, as previously mentioned, Rudner (1999) did find that test scores varied significantly based on amount of money spent on education, family income, parent education, and television viewing. Similarly, Ray (2010) in his study of the achievement test scores of homeschool students states,
There are statistically significant differences in achievement among homeschool students when classified by gender, amount of money spent on education, family income, whether either parent had ever been a certified teacher (i.e., students of non-certified parents did better), number of children living at home, degree of structure in the homeschooling, amount of time student spends in structured learning, and age at which formal instruction of the student began. However, of these variables, only parent education level explained a noticeable or practically significant amount of variance, 2.5%, in student scores; the other variables explained one-half of 1% or less of the variance.” (Ray, 2010, p. 43)
In regard to income as a confounding variable with academic achievement, homeschool advocates point out that in Ray’s (2010) study, “homeschool students in the lowest-income category scored well above the public school average.” Further, Martin-Chang et al.’s (2011) found in their match-pair study of homeschooled and non-homeschooled students that structured homeschoolers outperformed the non-homeschooled students on all academic achievement test sub-tests despite the fact that family income was significantly lower in the homeschool group. In regard to race, Brewer and Lubienski (2017) call Ray’s finding that “there was no difference between the achievement of White homeschooled students compared to African American homeschooled students – a striking difference compared to the persistent racial achievement gap in traditional United States public schools” (p. 5). The authors also acknowledge Ray’s finding that “homeschool students score above average on achievement tests regardless of their parents’ level of formal education or their family’s household income” (Brewer and Lubienski, 2017, p. 5). Drawing on several studies, the Center on Innovations in Learning (2016) states that “homeschooling is the only education approach in which youth of low SES [socio-economic status] achieve at levels that are as high scholastically as those of their higher-SES counterparts” (p. 100). However, Brewer and Lubienski (2017) maintain their theory that academic achievement in homeschools may be attributed to a confounding variable, stating in regard to race, “what is ignored is that White and African American families who homeschool share similar socioeconomic characteristics which are far more likely to explain the student outcomes” (p. 5).
Taking another perspective, Huseman (2015) suggests in regard to homeschool students’ performance on college entrance exams that “those who take these tests are likely already on the higher-achieving end of the group; as a whole, studies have shown that home-schoolers take college entrance exams at a lower rate than their public or private school peers” (p. 23). So, while Brewer and Lubienski (2017) noted a possible self-selection bias influencing the composition of the homeschool population itself, here Huseman (2015) suggests another source of self-selection bias influencing the composition of the homeschool students who opt to take specific assessments such that the group seeking testing is not representative of the homeschooler population as a whole.
Limitations
Limitations of the current study include the self-selected nature of the sample, as the students represented in the data set are those who sought out the assessment. In addition, the self-reported nature of the homeschool variable should be noted here as well. Given the variety of homeschooling methods and structures, including virtual learning and hybrid program enrollment (Gaither, 2017), and the variety of legal routes to homeschooling per state, including the establishment of a private or charter school for the family (HSLDA, 2020), students who meet the definition of homeschool student in the current study may self-identify with a variable category other than homeschool.
Implications
The current study found that the CLT scores of homeschool students were significantly higher than scores of students from other school types. On average, homeschool students’ adjusted total score on the CLT outscored private school students by 3 points, charter school students by 4.5 points, public school students by 12.2 points, and the “not provided” category by 4.5 points (Table 8) The differences in adjusted verbal scores were statistically significant but less pronounced with homeschool students’ scores averaging 1.3 points higher than private school students, 1.8 points higher than charter school, 4.5 points higher than public school students, and 1.4 points higher than “not provided” (Table 8). In writing, on average, homeschool students’ scores were 1.8 points higher than private school students, 2.3 points higher than charter school students, 5.4 points higher than public school students, and 1.6 points higher than “not provided” (Table 8). In the quantitative adjusted score, the homeschool students’ scores was significantly higher than only public school students, by 2.3 points, and “not provided,” by 1.4 points (Table 8).
This is consistent with existing studies, which have found higher performance by homeschool students than students from other school types on standardized achievement tests (Martin-Chang et al., 2011; Ray, 2010; Rudner, 1999) and college entrance exams (Clemente, 2006). Further research is needed to examine reasons for these consistent findings of high student achievement in homeschools. As noted, even critics of homeschooling acknowledge the favorable data on academic outcomes of homeschools, but they emphasize the lack of evidence for a causal link to the practice of homeschooling (Brewer & Lubienski, 2017, p. 3).
This consistent finding of superior academic performance by homeschool students may help to assuage concerns about the academic quality of homeschools which are often raised in the debate about the appropriate level of regulation of homeschools by the state. However, a common counterpoint raised by critics must be noted as well: that the current study and each of these studies cited except for the Martin-Chang et al. (2011) study, have limited generalizability to the homeschool population as a whole due to the self-selected nature of the sample. This points the way to areas for further research.
Recommendation for Further Research
Several other details of the findings warrant further investigation. For instance, in the current study, the MANOVA analysis intended to investigate whether scores within school type groups varied by a gender, ethnicity, or family income was not utilized due to the frequency of small group sizes and the violation of the assumptions of equal variance and covariance. Future studies may look for ways the data may be grouped or defined differently, or other statistical techniques may be utilized, in order to conduct these multivariate analyses of variance.
Additionally, homeschool student scores were not found to be significantly different than the scores of students in the “other” category on the total adjusted score or any of the three subtests. One route for further research is to investigate from which educational settings students who self-identify as “other” school type are coming and why the their scores do not vary significantly from students who identify as homeschooled. Similarly, future research could examine how consistent self-selection of school type is among students whose educational settings meet several school type categories, such as homeschool students enrolled in hybrid schools or homeschools registered as charter or private schools in their state.
It is also of interest that homeschool students scored significantly higher than all other school types except the “other” category on three of the four CLT score variables; on the adjusted quantitative score, however, homeschool students scored significantly higher than only the public school and “not provided” groups. Further research could investigate this finding by examining the differences in verbal and quantitative skills of homeschool students.
In addition, several demographic and categorical variables could be improved in future homeschool research. Ethnicity and race variables should provide options to select or reflect belonging to multiple groups. Income variables might include an inquiry into whether the household income comprises one, two, or more significant wage earners as an additional indication of socioeconomic status. This variable may be especially relevant to the homeschool population, as it is common for one parent to reduce or forego potential income in order to homeschool; the inability to do so may be a barrier to a family starting or continuing homeschooling.
Lastly, methodologically rigorous research on academic achievement in homeschools featuring a sample that is not self-selected is much needed. Significant challenges exist in conducting this type of research including difficulty accessing the population (Rudner, 1999), resistance to participation within the population (Murphy, 2012), and the expense associated with these undertakings, especially if the researcher will administer assessments for the study. It should be noted that Martin-Chang et al (2011) who aimed to address this gap in the literature by conduct a study comparing homeschool students and public-school students using a matched-pair sample recommends that future research of this type divide homeschools into ‘structured’ and ‘unstructured’ homeschoolers, as this was found to be a significant factor in academic outcomes; dividing the homeschool sample in this way may require a larger number of participants as compared to an undivided homeschool sample depending on the statistical analyses to be undertaken. In addition, future research may distinguish between students with varying duration of homeschool experience, such as ascertaining the percentage or cumulative years of students’ academic careers spent in various school types. Research such as this with rigorous methodology is needed in order to investigate potential causative factors contributing to the academic outcomes in homeschools.
Conclusions
The current study was intended to examine the academic outcomes of homeschools by studying data from the Classic Learning Test. This study aimed to address a gap in the literature by undertaking a quantitative study of significant sample size in which the researcher has no affiliation or compensation from homeschool or educational advocacy groups. The study yielded insights into the academic performance of homeschool students on the assessments. Results showed that homeschool students score significantly higher on the CLT test than students from other school types, which is consistent with existing literature on the academic achievement in homeschools (Clemente, 2006; Ray, 2010; Rudner, 1999). The study yielded several promising areas for further research including the need for research on homeschool academic achievement that does not feature a self-selected sample.
References
Brewer, T. Jameson, & Lubienski, Christopher. (2017). Homeschooling in the United States: Examining the rationales for individualizing education. Pro-Posicoes, 28(2), 1-8. http://www.scielo.br/scielo.php?script=sci_arttext&pid=S0103-73072017000200021&lng=en&tlng=en
Center on Innovations in Learning. (2016). Handbook on Personalized Learning for States, Districts, and Schools. (M. Murphy, S. Redding, & J. Twyman, Eds.) Philadelphia, PA: Temple University.
Classic Learning Initiatives, LLC. (2018). 2018 Technical Report. CLT Exam: https://www.cltexam.com/technical-report
Clemente, Dale F. (2006). Academic achievement and college aptitude in homeschooled high school students compared to their private-schooled and public-school counterparts [Doctoral dissertation]. Proquest Dissertations and Theses: https://search-proquest-com.libproxy.hbu.edu/docview/304920016/CF44C6D2E2D94B1CPQ/8?accountid=7035
Eggleston, Casey, & Fields, Jason. (2021, March 22). Homeschooling on the rise during COVID-19 Pandemic: Census Bureau’s Household Pulse Survey shows significant increase in homeschooling rates in Fall 2020. United States Census Bureau. https://www.census.gov/library/stories/2021/03/homeschooling-on-the-rise-during-covid-19-pandemic.html?utm_campaign=20210322msacos1ccstors&utm_medium=email&utm_source=govdelivery
Gaither, Martin. (2017). Homeschool: An American History, 2nd Ed. Mechanicsburg, PA: Palgrave MacMillan.
Home School Legal Defense Association. (2020). Homeschool Laws in Your State. HSLDA: https://hslda.org/content/laws/
Huseman, Jessica. (2015, August 27). The frightening power of the home-schooling lobby. ProPublica, pp. 1-31. https://slate.com/human-interest/2015/08/home-school-legal-defense-association-how-a-home-schooling-group-fights-any-meaningful-regulations-of-families-that-pull-their-kids-from-school.html
Martin-Chang, Sandra, Gould, Odette N., & Meuse, Reanne E. (2011). The impact of schooling on academic achievement: Evidence from homeschooled and traditionally schooled students. Canadian Journal of Beahvioural Science, 43(3), 195-202. doi:http://dx.doi.org/10.1037/a0022697
McQuiggan, Meghan, & Megra, Mahi. (2017). Parent and family involvement in education: Results from the National Household Education Surveys Program of 2016 (NCES 2017-012). National Center for Education Statistics. U.S. Department of Education. http://nces.ed.gov/pubsearch/pubsinfo.asp?pubid=2017102
Meyers, Lawrence S., Gamst, Glenn, & Guarino, A. J. (2017). Applied Multivariate Research: Design and Interpretation. Sage.
Murphy, Joseph. (2012). Homeschooling in America: Capturing and Assessing the Movement. Corwin Press.
Qaqish, Basil. (2007). An analysis of homeschooled and non-homeschooled students’ performance on an ACT mathematics achievement test. Home School Researcher, 17(2), 1-12. https://www.nheri.org/home-school-researcher-an-analysis-of-homeschooled-and-non-homeschooled-students-performance-on-an-act-mathematics-test/
Ray, Brian. (2010). Academic achievement and demographic traits of homeschool students: A nationwide study. Academic Leadership: The Online Journal, 8(1), 1-49. https://scholars.fhsu.edu/alj/vol8/iss1/7/?utm_source=scholars.fhsu.edu%2Falj%2Fvol8%2Fiss1%2F7&utm_medium=PDF&utm_campaign=PDFCoverPages
Rudner, Lawrence M. (1999). Scholastic achievement and demographic characteristics of home school students in 1998. Education Policy Analysis Archives, 7(8), 1-33. http://purl.access.gpo.gov/GPO/LPS7329
Sikkink, David, & Skiles, Sara. (2015). Homeschooling and young adult outcomes: Evidence from the 2011 and 2014 Cardus Education Survey. Cardus Religious Schools Initiative. https://www.cardus.ca/research/education/reports/homeschooling-and-young-adult-outcomes-evidence-from-the-2011-and-2014-cardus-education-survey/ ¯